
Cheshire election history (1979 - 2011): Council at large
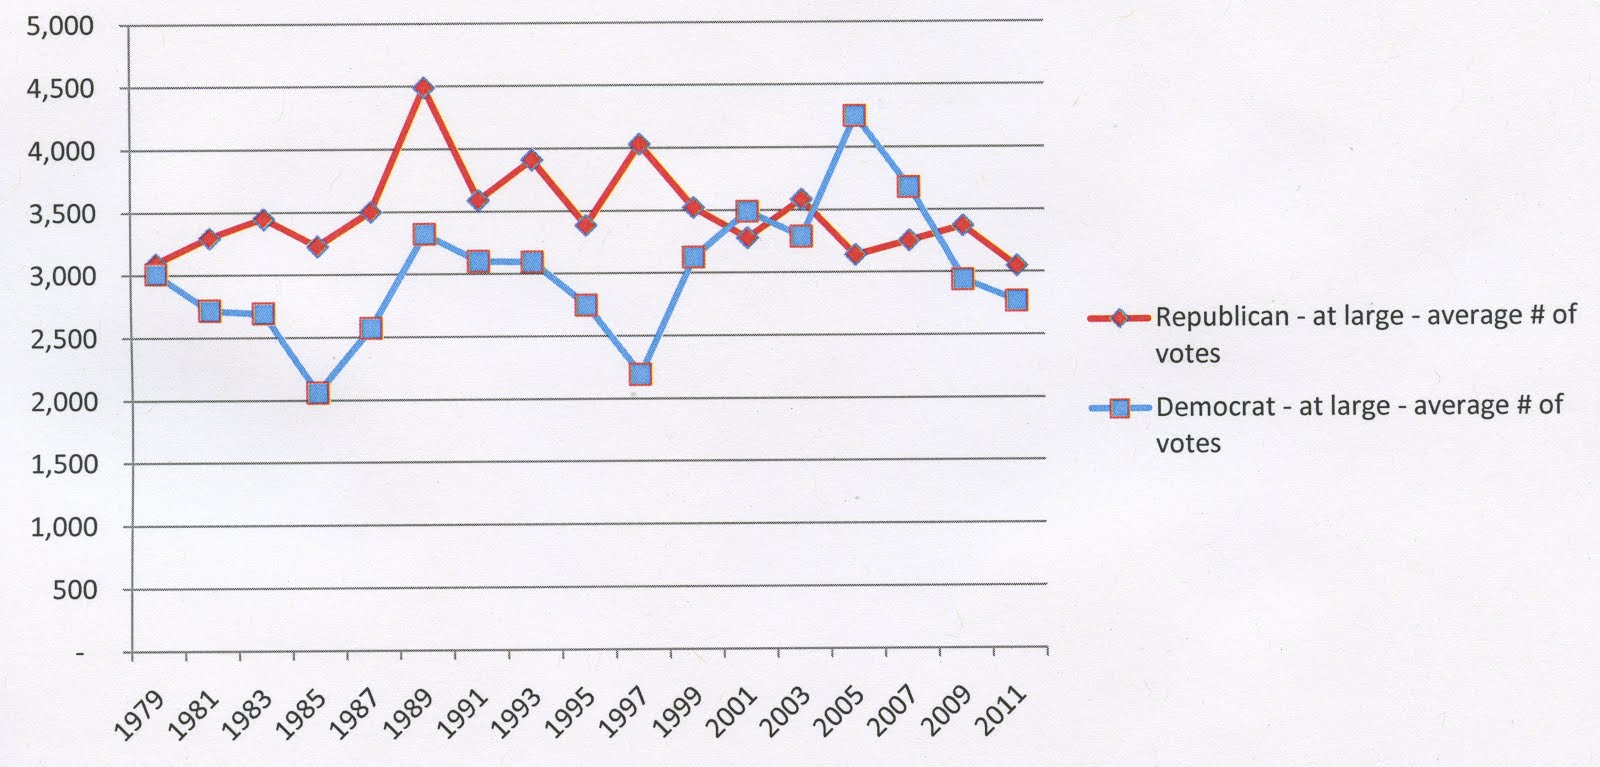
And here are the trendlines for Council at-large results. The first trend line is the average number of votes received by the at-large candidates for each party:
The second trend line is the average number of votes received by the at-large candidates for each party as a per cent of all voters:
 I'm running similar trends for BOE & PZC.
With regard to analyzing "blank" votes, I spent an hour or so trying to figure out a logical approach. But the nature of at-large races made it difficult for me to create a visual or graphic with any sort of relevance. I'm sure there's something that could be created, but I don't have the time to get my hands around it. So I'm simply offering these graphs, along with my source data. If you click thru to this google doc, you'll now find results for:
1) Council districts by precinct
2) Council at large by precinct
3) Council at large totals by candidate by ballot order
The most surprising thing to me was the result of the 1979 election. Dem candidates received the highest and 3rd highest vote totals. GOP candidates took 2nd, 4th and 5th place. So the election was, IMO, much closer than the 6-3 Republican victory might indicate.
Interesting to me are the 1979 Republican vote totals. In 5th place, Lagervall received 3051 votes, while Ferraro received 3049 votes. If my data are correct, Al Ferraro lost his 1979 election by only two votes. He then ran -- and won handily -- in the 4th District in 1981.
Anyway, I hope you find this interesting! I'll continue adding the source data to the same google doc for easier reference. And if anyone is a wiki user, feel free to link it to the Cheshire wiki page... or maybe I'll get around to it at some point.
Tim White
No comments:
Post a Comment