Cheshire election history (1979 - 2011): CEO totals
Since the President and Governor are only elected quadrenially, I'm posting their Cheshire election trends together. Although I graphed them separately, I found them to have a very interesting relationship.
Can you guess what that relationship is?
Anyway, here are the election results for POTUS. As you can see, for the past few Presidential elections, both the D and the R have received votes in the range of 7000 to 8000:

With regard to the "other" votes, the lion's share of those Presidential votes belonged to John Anderson in 1980, Ross Perot in 1992 and 1996, and Pat Buchanan in 2000.
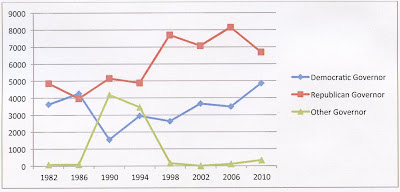
And here are the election results for Governor. What I find fascinating is that for the past few elections, the GOP candidate for Governor has received about 7000 to 8000 votes. Yet the Democratic candidate for Governor has received 3000 to 5000 votes:

Similar to the elections for POTUS, most of the "other" votes in the Gubernatorial elections went to a small number of candidates. And both of the two major Gubernatorial vote recipients belonged to A Connecticut Party, represented by Lowell Weicker in 1990 and Eunice Groark in 1994.
Now to recap:
President
Republican -- 7000 to 8000 votes
Democrat -- 7000 to 8000 votes
Governor
Republican -- 7000 to 8000 votes
Democrat -- 3000 to 5000 votes
In other words, this suggests that low turnout elections favor Republicans... while high turnout elections favor Democrats. So in a way, this suggests that there was a logic to the 2012 Democratic argument that Republicans were trying to suppress the vote. And this just happens to be Cheshire. We haven't been central to any Presidential general election in decades. Yet the logic holds true.
WRT "blank votes" I did not include them here. For the most part, there are generally very few blank votes for Governor or President. And for my source data on the Presidential and Gubernatorial elections, click here.
Tim White

No comments:
Post a Comment