Wednesday, July 03, 2013

Increasing the use of solar energy in Cheshire (2 of 3)

As I mentioned in my previous post, Connecticut faces some serious electricity problems.  This is due to our reliance on centralized generation (CG).  An alternative to the CG -- typically provided by nuclear, natural gas and coal-fired power plants -- is distributed generation (DG).

Probably the most common existing form of DG is a household generator.  (I quickly found a 4 kW generator online for $400, while a 7 kW generator is listed at $900.  Installation by an electrician may run the cost up to $2,000.)

Another -- and increasingly popular -- form of DG is solar electricity.  It's also known as a photovoltaic array or PV.  Solar electric is the cause of the Solarize CT campaign.  And it's the Solarize CT campaign that I hope to bring to Cheshire as Solarize Cheshire!

Why undertake a campaign?  Why bother?

The Solarize campaign concept began in Massachusetts and had demonstrable results.  So the State of CT decided to undertake a similar campaign to increase the use of solar electric in The Land of Steady Habits.

Thus far, the campaign has existed in three outreach phases:

- Phase 1 occurred from Sept 2012 to Jan 2013.

- Phase 2 is ongoing, beginning around April 2013 with a scheduled completion of July 2013.

- Phase 3 has not yet begun, though the State's RFP was issued about three weeks ago with a July 12th deadline... and the campaign to be undertaken from Sept 2013 to Jan 2014.

It's the current RFP of Phase 3 that has my interest because the program has shown clear results.

Not only has the program reduced the cost of solar by about $8,000 / home, it's also increased the number of homes getting solar electric installed by ten-fold.  That means more local jobs, rather than jobs in CG plants that will probably be both distant and have negative impacts on the environment.

$8,000 is a lot of money.  How do I get that savings?

A typical CT home buys about 7.1kW of solar electric.  Of CT's 169 towns, four participated in Solarize Phase 1.  Within those four towns, the average cost of one kW was about $3,800.  Within the other 165 towns, the average cost of one kW was about $4,900.

So instead of paying about $35,000 for your solar electric installation, you pay about $27,000.  And yes, at $27,000, the economics make sense.  Just consider what you pay for your monthly electric bill.

$27,000 is a lot of money.  How does that help me?

You probably pay around $100/mo to CL&P.  That translates to about $1200/yr.  And with an estimated 25 year life for solar electric panels, you'd get a payback at around 22 years.  But that's not accounting for benefits like the 30% federal income tax credit that you can take.

More on the numbers later.  I'll leave it here for now and try to elaborate further this weekend.

Tim White

Sunday, May 19, 2013

Increasing the use of solar energy in Cheshire (1 of 3)

The State of Connecticut has major electricity difficulties in our future.  It's true that CT produces (~33million MWh) more electricity than we consume (~30million MWh) annually, but peaking issues complicate the matter.  In other words, we consume a lot more energy on July afternoons than we consume at 3am in mid-May.

Peaking issues lead to our current transmission need for importing electricity from other places, such as Quebec's hydro power, via the Northern Pass that cuts south through New Hampshire and Massachusetts.  Obviously, this leads to environmental concerns.  But the transmission issues are not the only delivery problem we face.

We have delivery service problems with both transmission and distribution.  While transmission services bring electricity across great distances at high voltage, distribution services bring low voltage electricity from the "step down" transformers to your house.  And it's with the power lines on your street that we face another problem:  old infrastructure.

So our electricity problems face both transmission and distribution issues, along with other issues, such as the emissions from fossil fuels plants.  One way to address these issues is to generate electricity in CT.

Solar photovoltaic arrays (PV) are one way to do this.  Although current PV technology is not a panacea, it would mitigate the problems we face in the Constitution State.  That's why we're trying to take action in Cheshire.

The idea started with the state program Solarize CT.  I'll explain that in an upcoming post, but I need to sign off for the night.

Tim White

Sunday, March 31, 2013

Sequester closure date for Connecticut airports

For all the bluster over the dire consequences of sequestration, the only thing that's caught my attention has been airport closings.  I've used Tweed New Haven in the past and could use it again.  But when March 1st came and went and nothing changed, I finished my yawn... having had my views of government officials reinforced.  (That is, they knowingly lie or are too clueless to ask the right questions and get real answers.)

Anyway, for the Nutmeggers who are interested in when the sequestration is supposed to impact CT airports, I found the airport closing list here.  CTs airports are listed as follows:

Stratford (BDR) -- 5 May 2013
Danbury (DXR) -- 5 May 2013
Groton (GON) -- 21 April 2013
Hartford (HFD) -- 5 May 2013
New Haven (HVN) -- 5 May 2013
Oxford (OXC) -- 5 May 2013

Just outside of CTs borders is Westchester Airport.  I don't see it on the closure list.  As well, news reports seem to say that Hartford's Bradley (BDL) isn't impacted.  And I'm guessing that small airports, such as Meriden, don't have towers?  Regardless, I was curious about Tweed.  And I got my answer:  May 5th is the targeted date for closure.

Tim White

Wednesday, March 06, 2013

Summer-only pool?

At the February Council meeting I voiced my opposition to spending more money to fix the bubble damage that occurred during Nemo.  I've been tired of the pool spending for years... as I think a majority of town residents have been too.  But for years the Council had supported the never-ending spending that had been predicated on the 1996 fallacy that the pool would be:

1) open all year; and

2) self-supporting.


But is the never-ending supporting coming to an end?

Is the Town Council's view of the "need" for a year-round pool -- broken from the attached promise of self-sufficiency -- moving?

The MRJ is reporting on that two Council members, Tom Ruocco and David Schrumm, are also voicing spending concerns.  And while Tom has fought the unnecessary pool spending for years, David's shift is significant in the movement toward ending the wasteful pool spending.  While there have been many such pool spending votes, one of the more memorable that comes to mind is the $20,000 that got thrown away on a pool consultant.

The MRJs Eve Britton reports:

Town Council Budget Committee Chairman David Schrumm agreed that a permanent solution has to be found, and if it can’t be, making it a summer-only pool is the only viable option.

If David is serious about moving beyond the bubble, then the Council may finally be moving toward a real solution -- summer only.  As a member of the Council I voted to send the failed $7,000,000 permanent structure to the voters for consideration.  We've already gone down the path of a permanent structure and the voters rejected it 61% to 39%.  And considering the costs involved, I find it hard to believe a not-for-profit will want to take on the pool.

The logical option is summer-only.  Particularly if the cost to fix the bubble -- less insurance reimbursements -- is significant, I hope the Council seriously considers moving to a summer-only pool.

Tim White

Tuesday, February 12, 2013

Cheshire's census data: mapping income

While the US Constitution calls for an actual enumeration of Americans, the enumeration (basically the US Census) no longer includes income data.  It's now conducted via the American Community Survey.

If you're interested in learning more about Cheshire's income, you can click here.  It's a map that shows Cheshire as five neighborhoods:  northeast, northwest, southeast, southwest & east (central).  The "neighborhoods" generally mirror Cheshire's four Council districts and have median household incomes as follows:

Northeast:  $124,000

Northwest:  $112,000

Southeast:  $98,000

Southwest:  $112,000

East (central):  $99,000

So I guess I live in Cheshire's "poor neighborhood."  j/k.  There certainly are some people in need, but I don't think any 20% segment of Cheshire can be considered poor.

Tim White

Wednesday, February 06, 2013

Cheshire election history (1979-2012): CEO turnout

In the continuing series on Cheshire's election history, here you can see three data points for Cheshire's elections for POTUS:

1 - voter registration

2 - voter turnout (total # of voters who cast a ballot); and

3 - votes for President (total # of voters who cast a ballot for President.


Here are the equivalent data for Gubernatorial races:


Due to my inability to manipulate excel, I separated the two trends into two different graphs. Furthermore, I matched the voter registrations to the year of the election. As a result, the voter registration trends for POTUS and Governor are different.

And here's the graph that I thought may be of most interest to you, % turnout by year. Again though, I faced system constraints with excel. So I coupled two successive elections together for each point on the horizontal axis. Anyway, you can see here that about 80% to 90% of Cheshire voters typically turnout for a Presidential election... while 60% to 70% turnout for Gubernatorial elections.


And of course, you can find my source data here.

Tim White

Tuesday, February 05, 2013

CCM vote: Forget R vs. D, think Authoritarians vs. Populists

As I noted in a recent post, some Council members were surprised by -- and concerned about -- a recent TM vote at a CCM meeting. And the concern did not fall along party lines.

Council members David Schrumm (R) and Peter Talbot (D) were quite comfortable with the TMs vote. Some Council members -- including Patti Flynn Harris (D), Tom Ruocco (R), Jimmy Sima (R) and Chairman Tim Slocum (R) -- were not happy with the TMs vote because he spoke for the Council without ever having received any Council guidance. One Council member, Mike Ecke (D), saw "both sides" of the issue.

This non-party line view reminded me of a little discussed concern that was addressed in 1824 by Thomas Jefferson in a letter to Henry Lee:

Men by their constitutions are naturally divided into two parties:

1. Those that fear and distrust people, and wish to draw all powers from them into the hands of the higher classes.

2. Those who identify themselves with the people, have confidence in them, cherish and consider them as the most honest and safe, although not the most wise depository of the public interests. In every country these two parties exist; and in every one where they are free to think, speak, and write, they will declare themselves.

Far too often the public discourse focuses on Republicans vs. Democrats. But much of the time, I feel that the less discussed issue -- authoritarianism vs. populism or aristocrats vs. republicans / democrats -- is the more important issue.

In this situation of the TMs vote, it seems likely to me that you have a possible window into the authoritarian / populist tendencies of Council members.

And as Jefferson wrote that I would... I declare myself as an aspirant for belonging to the second group.

Tim White

Monday, February 04, 2013

Cheshire election history (1979-2012): The power of incumbency

From 1979 to 2012, we've had 17 local elections.  We've also had four Council districts (1st District2nd District3rd District, and 4th District) since Cheshire got a Charter with elections beginning in November 1971.  So since 1979, we've had 68 Council district elections.

Of those 68 elections, only four elections have seen elected incumbents defeated:

1991 -- 3rd District, George Bowman (D) defeated Gil Leslie (R)

1995 -- 2nd District, Tom Stretton (D) defeated John Perotti (R)

2003 -- 4th District, Tim White (R) defeated Lynn Salzer (D)

2009 -- 3rd District, Andy Falvey (R) defeated Laura Dicaprio (D)

There have been a number of appointed incumbents defeated at the polls.  But my point here is about the power of incumbency for elected Council members.

So only four times in 68 elections* have elected incumbents lost reelection.  Elected incumbents normally win.  And two times, elected incumbents were not even challenged:

2001 -- 1st District, Sheldon Dill (R)

2011 -- 1st District, David Schrumm (R)

Before I began this study of Cheshire's election history, I knew that the federal and state levels reelected incumbents about 95% of the time.  Now we know that the same holds true for local elections in the Council districts.

And one last tidbit... of the four challengers who won, three of them won on their first time out.  Who was the stupid one who thought he could beat the odds even after losing once?  Me!  :)

Tim White

* Of the 68 elections, I'm not really certain that it was all elected incumbents who ran in the 1979 contest.  And I did find the 1971 to 1977 election records in the Town Clerk's Office, but they're not a high priority for me.  So that data collection will wait.

Saturday, February 02, 2013

Council views on Town Manager's CCM vote

In a January 17th post I raised an issue related to the unelected Town Manager who, during the prior week, went beyond his authority at a CCM meeting in which a vote was taken on gun control.

Following the vote, on January 16, the MRJ printed this article in which the unelected TM opines on the measures:

I think that they were very reasonable

This caught my attention because the elected Council had not deliberated gun control during a public meeting. So I posted the following question intended for elected Council members:

Did you publicly, or privately, either individually or collectively, direct the TM to advocate for this?

And thanks to the press, we're beginning to understand the views of elected Council members, particularly on the extent to which the unelected TM has authority to speak as a representative of Cheshire. The MRJ kicked off our understanding with this January 17 piece:

Ruocco (R) - “It’s frustrating when you get emails from people who are upset. They feel like they’ve gotten sidestepped"

Flynn-Harris (D) - said Milone shouldn’t have cast the vote if it was viewed as representing town government’s position on gun policy.

Talbot (D) - had no issue with Milone’s vote, saying the town manager is asked to represent the town at CCM.

The Cheshire Patch largely rehashed the MRJ talking points, but the WRA added some new insights on the unelected TMs authority to use his office to advocate his own personal political agenda without any guidance or direction from elected Council members:

Ecke (D) - sees "both sides"

Slocum (R) - the Councilman named in the WRA piece "Manager chided for vote"

Separate and apart from the above news pieces:

Sima (R) - agrees with Ruocco and Slocum that the TM overstepped his authority

Schrumm (R) - agrees with Talbot that this vote represented the personal view of the TM, not the view of the Town

Falvey (R) - unknown

Nichols (R) - unknown

Interesting to me is that these responses regarding the TM's vote do not fall along party lines.

But perhaps the most telling comment so far came from our northern border via the MRJ:

Southington Town Manager Garry Brumback was present at the meeting but abstained from voting. “My job is not to participate in policy discussions,” he said. “My job is to implement.”

Tim White

Wednesday, January 30, 2013

Cheshire election history (1979 - 2012): US House

Continuing with Cheshire's election history since 1979, I offer the history of our Congressional elections. For all of this time, we've been a part of the US House's 5th Congressional district or CT-5.

You'll notice that for the CT-5 I've included both non-major parties and "blank" votes.  And I feel it's worth noting that a good amount of non-major party votes include cross-endorsements for major party candidates, such as 900 votes for Chris Murphy in 2008 on the Working Families party line.

And as we write the history books on Cheshire politics, as I've mentioned before, in 2005 Chris Murphy went to Rahm Emanuel and asked for money to run against then-incumbent Congressman Nancy Johnson. When Rahm asked for evidence that the CT-5 was winnable, Murphy pointed to electoral trends in Cheshire, such as party affiliation.

Murphy got the money and it appears to me that recent history has proved Chris Murphy's assertions to be true.

For the source data on this graph, click here.

Tim White

Tuesday, January 29, 2013

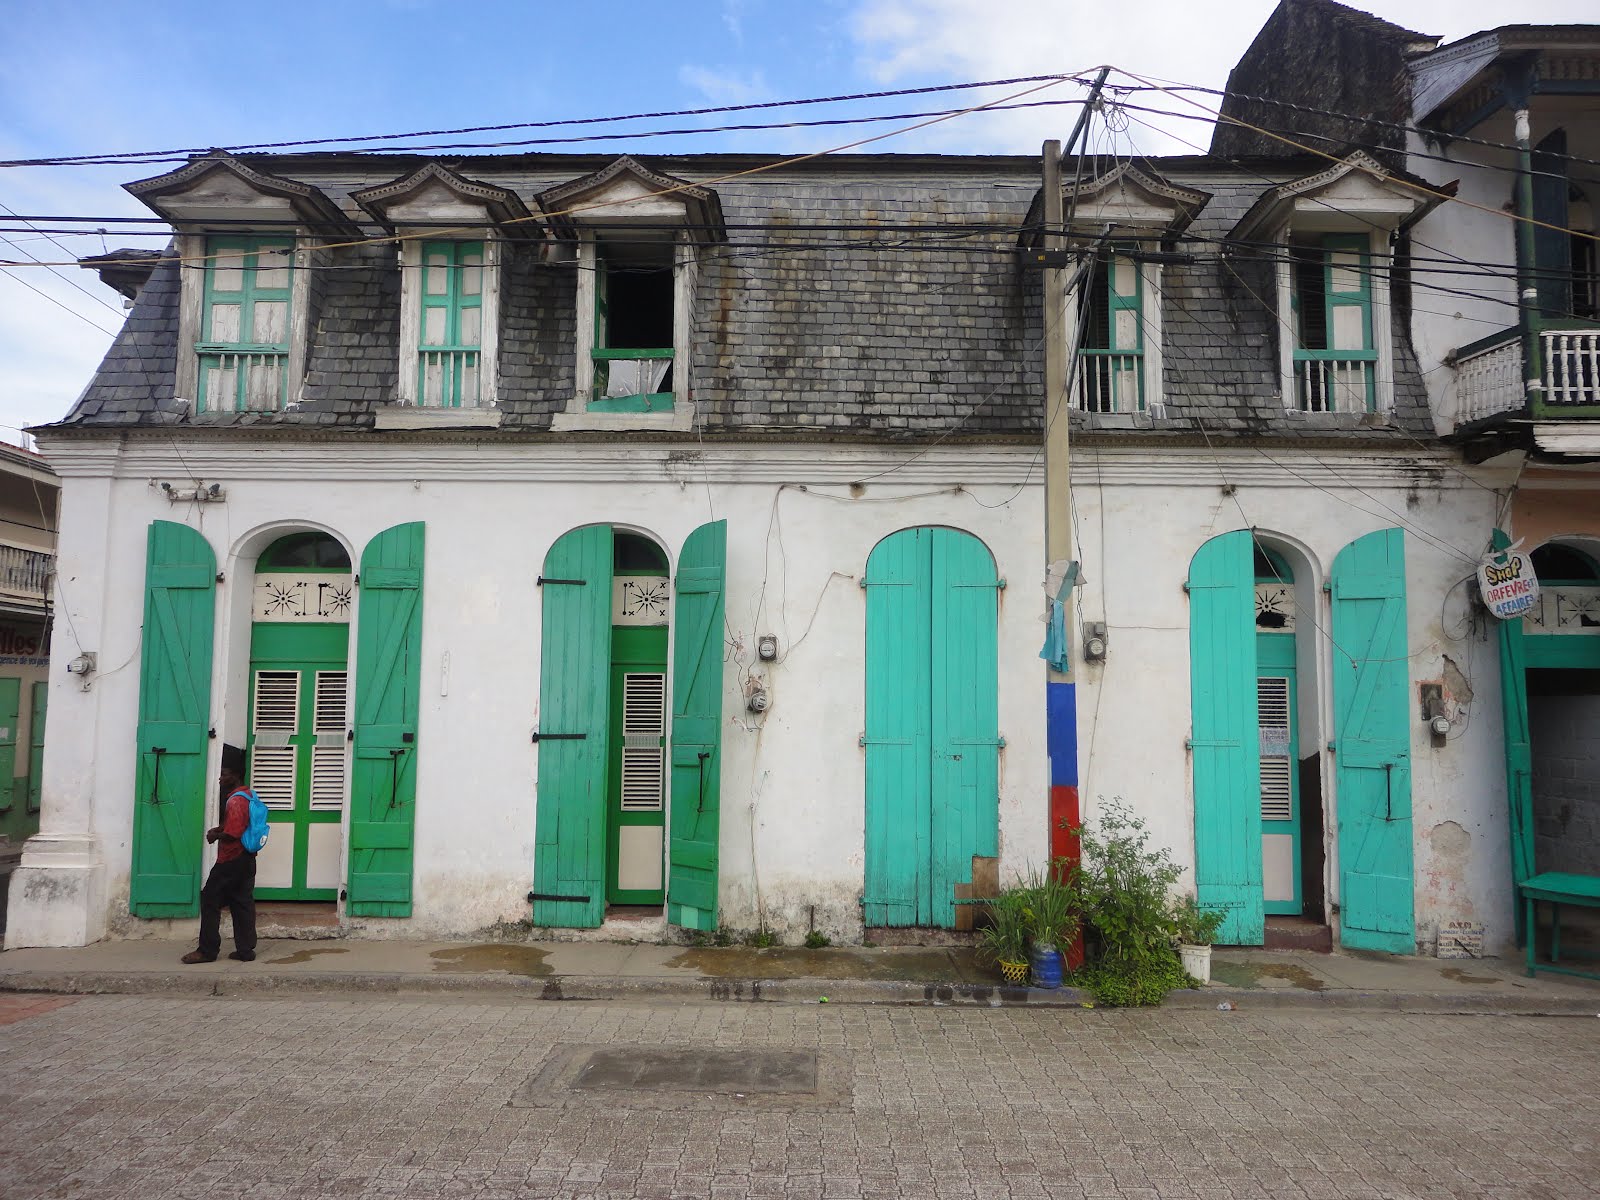
A day in the life: The doors of Cap Haitien

Haiti's main city is Port-au-Prince. PAP is the capitol and the heart of Haiti. It can seem like an entirely different world from the rest of Haiti. Sometimes PAP is even called the "Republic of Port-au-Prince." :)

There are other cities in Haiti though. The second biggest city in Haiti is Cap Haitien. I had the chance to visit in August 2011. Although my main draw to Cap Haitien was the awe-inspiring Citadelle, what I found was... in its own way... enchanting. I give you...

The doors of Cap Haitien!


I love the colors...


especially the pastels...


Look... Donald and Mickey are everywhere!


This is a lottery stall of sorts. It's one of thousands, maybe tens of thousands, of such gambling halls across Haiti.


And again... those beautiful Caribbean pastels.


Tim White

Monday, January 28, 2013

Cheshire election history (1974 - 2011): Party affiliation

I'm guessing that this trend line is imperfect. The dip in unaffiliated voters around 1987 is probably too big. But as I've said, while this data is a fair representation of the election trends over the past few decades, it's also imperfect. Anyway, the large margin of registered Rs over registered Ds is correct for thirty years ago. And that voter registration margin did shrink until around 2006 when the Dems pulled even with the GOP in registration and soon pulled ahead.

I looked at graphing the four Council districts, as well as the seven precincts, but have decided against publishing them. They just don't make much sense because the year-on-year data is inconsistent. And that became evident in several ways, including the decennial redistricting.

So you should be able to see my source data (by year, by precinct) by clicking here, but I'm not convinced that you'll see anything particularly interesting in the trends. Also, the date of measurement was inconsistent from year to year.  The date of measurement for most years happened in January, but that's not the case for every year.

One note of interest for me is a story I heard back in early 2006. As then-state Senator Chris Murphy was looking build his campaign warchest, he went to Rahm Emanuel and asked for funding. When The Godfather asked for evidence that then-Congressman Nancy Johnson was beatable and the CT-5 was winnable, Murphy used Cheshire as the prime example of how the CT-5 was trending Democratic. Based on this trend, it appears Chris Murphy was correct.

Also, the election records for party affiliation happen to date back to 1974, not 1979.  So we have a bit more data for this trend.  And going back to 1974 was of interest to me.  It was the most recent year in which I found a precinct in which the plurality of voters was affiliated with a major party.  In the 6th District in 1974, there were 279 Rs, 276 Us and 123 Ds.  Since then, I believe unaffiliated voters have represented either a plurality or majority of the voters in every precinct.

Tim White

Saturday, January 26, 2013

Cheshire election history (1979 - 2011): CEO totals

Since the President and Governor are only elected quadrenially, I'm posting their Cheshire election trends together. Although I graphed them separately, I found them to have a very interesting relationship.

Can you guess what that relationship is?

Anyway, here are the election results for POTUS. As you can see, for the past few Presidential elections, both the D and the R have received votes in the range of 7000 to 8000:

With regard to the "other" votes, the lion's share of those Presidential votes belonged to John Anderson in 1980, Ross Perot in 1992 and 1996, and Pat Buchanan in 2000.

And here are the election results for Governor. What I find fascinating is that for the past few elections, the GOP candidate for Governor has received about 7000 to 8000 votes. Yet the Democratic candidate for Governor has received 3000 to 5000 votes:

Similar to the elections for POTUS, most of the "other" votes in the Gubernatorial elections went to a small number of candidates. And both of the two major Gubernatorial vote recipients belonged to A Connecticut Party, represented by Lowell Weicker in 1990 and Eunice Groark in 1994.

Now to recap:

President
Republican -- 7000 to 8000 votes
Democrat -- 7000 to 8000 votes

Governor
Republican -- 7000 to 8000 votes 
Democrat -- 3000 to 5000 votes

In other words, this suggests that low turnout elections favor Republicans... while high turnout elections favor Democrats. So in a way, this suggests that there was a logic to the 2012 Democratic argument that Republicans were trying to suppress the vote. And this just happens to be Cheshire. We haven't been central to any Presidential general election in decades. Yet the logic holds true.

WRT "blank votes" I did not include them here.  For the most part, there are generally very few blank votes for Governor or President.  And for my source data on the Presidential and Gubernatorial elections, click here.

Tim White

A day in the life: The kids at St. Pierre School

Here are some pix of the kids at a school that is sponsored by HHF.

Me with the kids:
Here's a result of the poverty. Injuries may not get treated:
Eating candy that I had bought for the kids:

And here are some of the kids playing just outside the school. I don't recall with certainty, but I'm guessing I probably took these pix on a Saturday or Sunday when I often went for a walk around town:


Tim White

Friday, January 25, 2013

Cheshire election history: ballot placement matters

One election issue I had pondered in the past:

Does ballot placement matter?

In particular, I wondered if it mattered for at-large Council candidates.  So I analyzed this question by summing the votes for each of the Council at-large candidates for each of the past 17 elections.  My sum totals for each column included Ds and Rs, but excluded other parties, that would probably appear in the 1st column.

The total votes for all 17 elections for each column, including the D and the R:

1 - 114,626
2 - 108,608
3 - 109,602
4 - 111,590
5 - 83,638

And for the 17 elections, both Ds & Rs ran at least four candidates each.  However, five of the elections did not have a fifth candidate in one or two parties.  Of those 34 slots, 27 slots were filled with at-large candidates.  Five times the Dems ran four AL candidates.  Two times the GOP ran four AL candidates.  I used these two values (34 & 27) to calculate the average number of votes per "candidate column."

To review my data, you can see my source data here.

The average number of votes for each at-large candidate in each column was:

1 - 3,371
2 - 3,194
3 - 3,224
4 - 3,282
5 - 3,098

Nowadays, the ballot placement occurs by a drawing in the Registrar's Office.  Back in the 1980s, the ballot placement was alphabetical.  If we assume that a random drawing and alphabetical placement are similar, then I would think that the votes received by each column would be close to similar.  But that's not the case.

My conclusion is that ballot placement matters.  If you get placed in the 1st column, you are almost certain to draw additional votes -- perhaps 100 to 300 votes -- that you would not have received if you appeared in a later column as an at-large Council candidate.

Tim White

Federal investigation of legislature demonstrates need for LCO 304 (subpoena power)

Daily Ructions is continuing their reporting on the federal investigation into corruption in the Legislature's administrative arm:

A federal investigation of corruption at the state legislature had bureaucrats scrambling last fall to obtain legal representation for the Legislative Commissioner’s Office (LCO) and, weeks later, the Executive Director of the Office of Legislative Management (OLM) after Attorney General George Jepsen “declined to represent” the legislative offices...

Documents obtained by Daily Ructions reveal that those bureaucrats have gone to extraordinary lengths to keep information from taxpayers about the actions they are taking to protect the interests of their agencies and themselves at significant public expense.

You can read the rest of Kevin Rennie's story here.

I'm glad Rennie is following this, but I'm also glad that Rep. Al Adinolfi and Sen. Joe Markley introduced this session's legislation -- LCO No. 304:

AN ACT CONCERNING INVESTIGATIVE SUBPOENAS.

Be it enacted by the Senate and House of Representatives in General Assembly convened:

That the general statutes be amended to authorize a state's attorney to issue a subpoena compelling a person to appear and testify or produce property necessary and relevant to an investigation into the possible commission of a crime.

Even if this legislation only applied to legislators, I'd be thrilled. Following the Donovan scandal, the legislature has demonstrated the need for someone to police them. Why leave the policing to only federal investigators? State investigators should also have the tools to go after corrupt politicians.

Tim White

Monday, January 21, 2013

Adinolfi and Markley introduce "subpoena power" legislation

As I mentioned last month, State Rep. Al Adinolfi and State Sen. Joe Markley have introduced legislation to restore subpoena power to Connecticut's State's Attorneys.

The crux of my concern is that Connecticut has a significant amount of corruption that gets investigated by federal authorities, rather than state authorities. (Think: Rowland, Newton, Giordano, Deluca, Ganim, etc.) And the reason it's typically the feds is that state investigators lack certain authorities, such as subpoena power, that are generally granted to federal investigators.

This lack of investigative ability first came to my attention in 2007 when I read this NYTimes editorial. And nothing has changed since then, as indicated in this December 28, 2012 Courant editorial:

We support any new effort to grant investigative subpoena power to state prosecutors.

Why do federal prosecutors crack most high-profile white-collar-crime cases in Connecticut — such as the Rowland scandal and the ongoing investigation into Chris Donovan's congressional campaign committee? Because they can compel testimony.

Give state prosecutors the tools to do the job.

And if you want to track the progress of this bill, click here.

Tim White

Thursday, January 17, 2013

Happy 7th birthday to TWL!

Happy birthday TWL! You were born seven years ago today.

Town of Cheshire advocates gun control

Earlier this week, a state wide organization named the CT Conference of Municipalities (CCM) voted to endorse their view of gun legislation.  You can see the 13 measures by clicking here.

Cheshire is a member of CCM. And IIRC, the town pays around $10,000 to $20,000 annually to be a member of CCM.  So you may wonder if CCM is worth the cost to the taxpayers?

Well, there certainly is some value IMO.  For example, when I was on the Council I used them several times for aggregation of data on municipalities for comparison purposes. One instance that comes to mind relates to my investigation of the use of Defined Benefits vs. Defined Contributions Pension Plans by municipalities.

Anyway, the MRJ is reporting that there was overwhelming support for CCMs proposed legislation. Among those in favor of the bill was the Cheshire representative to CCM, Town Manager Michael Milone.

As the MRJ reports:

Cheshire Town Manager Michael Milone was among the CCM members who voted in favor of the gun control measures. “I think that they were very reasonable,” he said.

My question for the Council:

Did you publicly, or privately, either individually or collectively, direct the TM to advocate for this?

I'm pretty sure that the Council has not deliberated gun control.  It's really a state issue.  Hence, CCM is advocating for state legislation.

However, if five (or more) Council members individually contacted the TM, then I can understand why the TM voted as he did.  But if that's the case, I feel those Council members should share those views with the public.  And if there were not at least five Council members who encouraged the TM in this manner, then there's an entirely different issue that should be addressed.

Tim White

Wednesday, January 16, 2013

Cheshire election history: Vote total averages among boards

I wasn't sure what I wanted to represent with the BOE and PZC. It's not uncommon for either party to run only two -- or even just one -- candidate for either of these two boards. Complicating the review of PZC election results is the fact that much of the history does not indicate if PZC candidates were for six, four or two year terms.

If it's an election for a partial term, it's usually a one-on-one race. Such races have different results from at-large races. As such, I concluded that I wasn't going to be able to find any useful trends in the BOE and PZC election results. Nonetheless, I did wonder about one thing...

For which board are people most likely to cast ballots? Do some people vote for Council at-large, then "blank" PZC at-large?

The following graph is an indication of the average amount of votes cast for each board (Council, BOE & PZC), regardless of party:Based on this graph, it appears that the board with the most stability in votes is the Council. Often receiving more votes than the Council, but in a relatively volatile fashion, is the BOE. And generally voters cast the fewest ballots for PZC. The one major exception to PZC happened in 2011. That's probably a result of the GOP running only one six year candidate: Woody Dawson.

For reference, I've added the results for 1979 to 2011 here. You should see spreadsheet tabs near the bottom of the screen. As well, when you look at the PZC tab, you should look at Column C. This was my best guess as to the office for which each candidate was running. Sometimes the office was noted in the Election Records. But at other times, no indication was given about the particular seat. For example, 1999 saw nine Republicans running for various PZC seats. Three of those seats were PZC alternates, but the records I reviewed gave no clear indication about the other six candidates and whether they were running for six, four or two year terms.

Hope you find the BOE and PZC election results interesting!

Tim White